 ar
ar bg
bg hr
hr cs
cs da
da nl
nl fi
fi fr
fr de
de el
el hi
hi it
it ko
ko no
no pl
pl pt
pt ro
ro ru
ru es
es sv
sv tl
tl iw
iw id
id lv
lv lt
lt sr
sr sk
sk sl
sl uk
uk vi
vi et
et hu
hu th
th tr
tr fa
fa ms
ms hy
hy ka
ka ur
ur bn
bn mn
mn ta
ta kk
kk uz
uz ku
ku
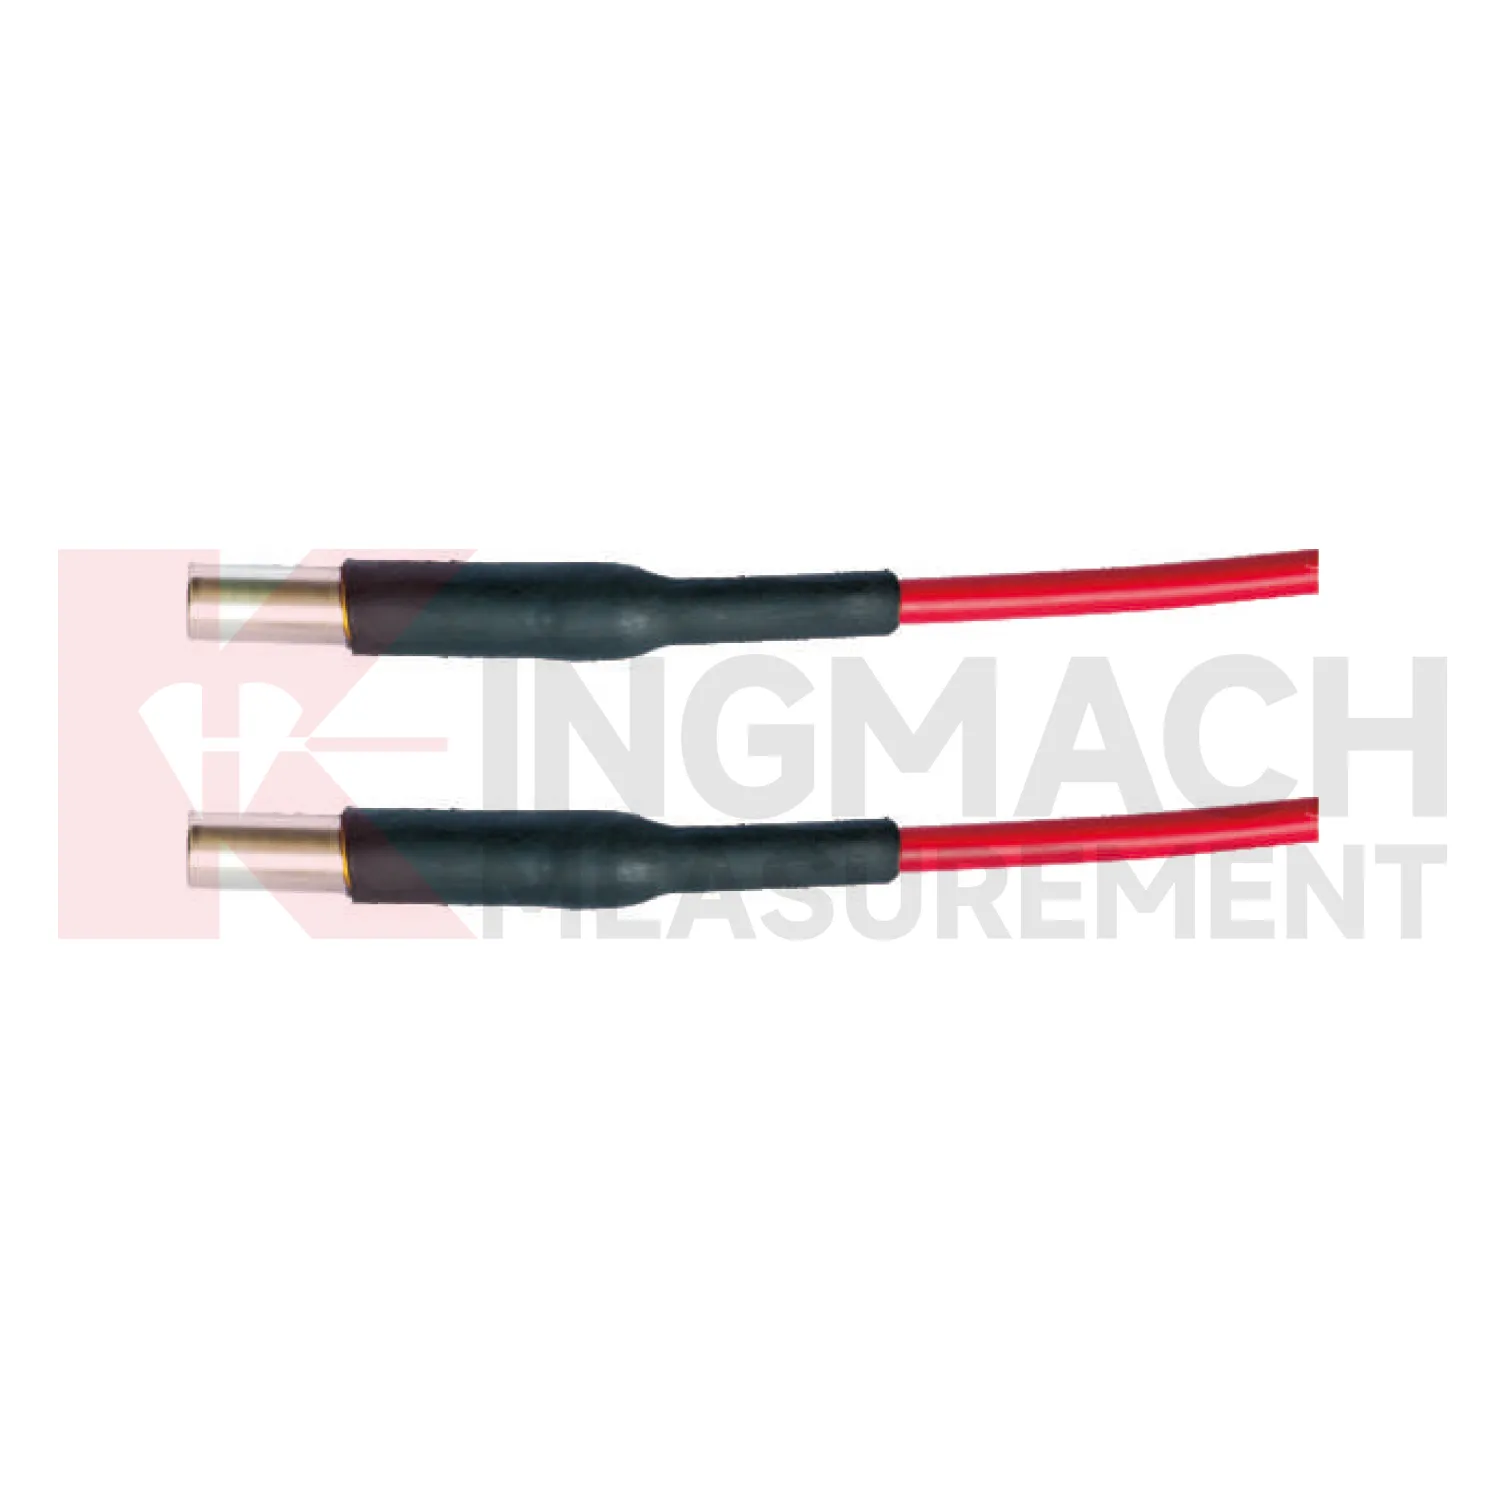
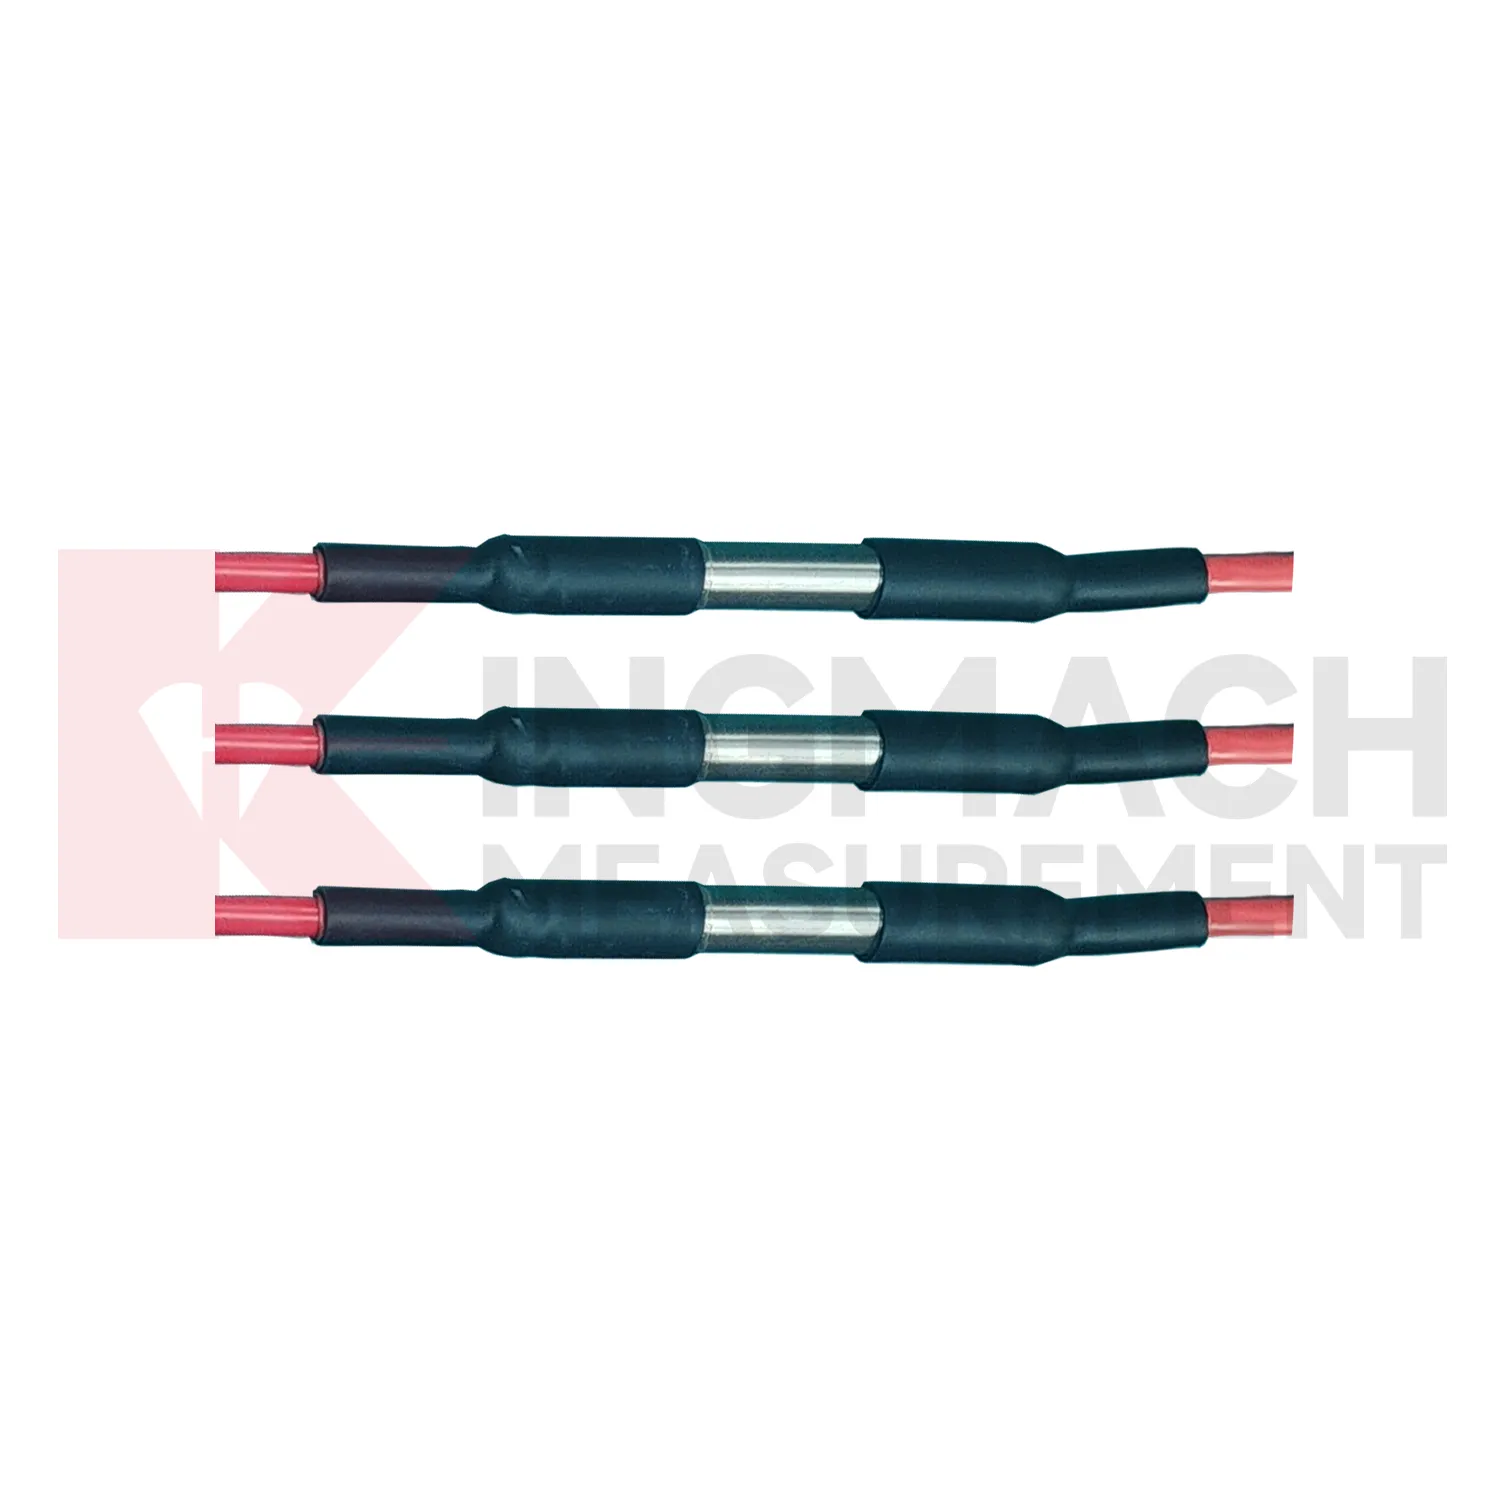
tipping bucket rain gauges
Pressure monitoring in Kingmach tipping bucket rain gauges is useful when the project needs to understand wind load, air movement, gas pressure, or controlled pressure differences around equipment and structures. A pressure point may support bridge response review, ventilation systems, enclosed spaces, dry gas control, or antechamber monitoring. The installation should protect the pressure path from blockage, water, dust, loose tubing, and accidental disconnection. Because pressure data often changes quickly, channel naming and time alignment are important. If pressure is being compared with vibration, wind speed, or structural movement, the records should share a review timeline. A pressure value without context may be hard to judge. A pressure value connected to wind direction, operating condition, and structural response can explain why a vibration, alarm, or access issue occurred.
For owners, the strongest record is the one that remains understandable after staff changes. Clear units, plain point names, installation photos, maintenance notes, and linked structural channels make the data usable beyond the original project team.
For field teams, this point is most useful when the record shows the condition before the structural response, during the response, and after the site returns to routine operation. The note should include weather timing, inspection access, nearby construction, and whether the linked structural points changed in the same period.

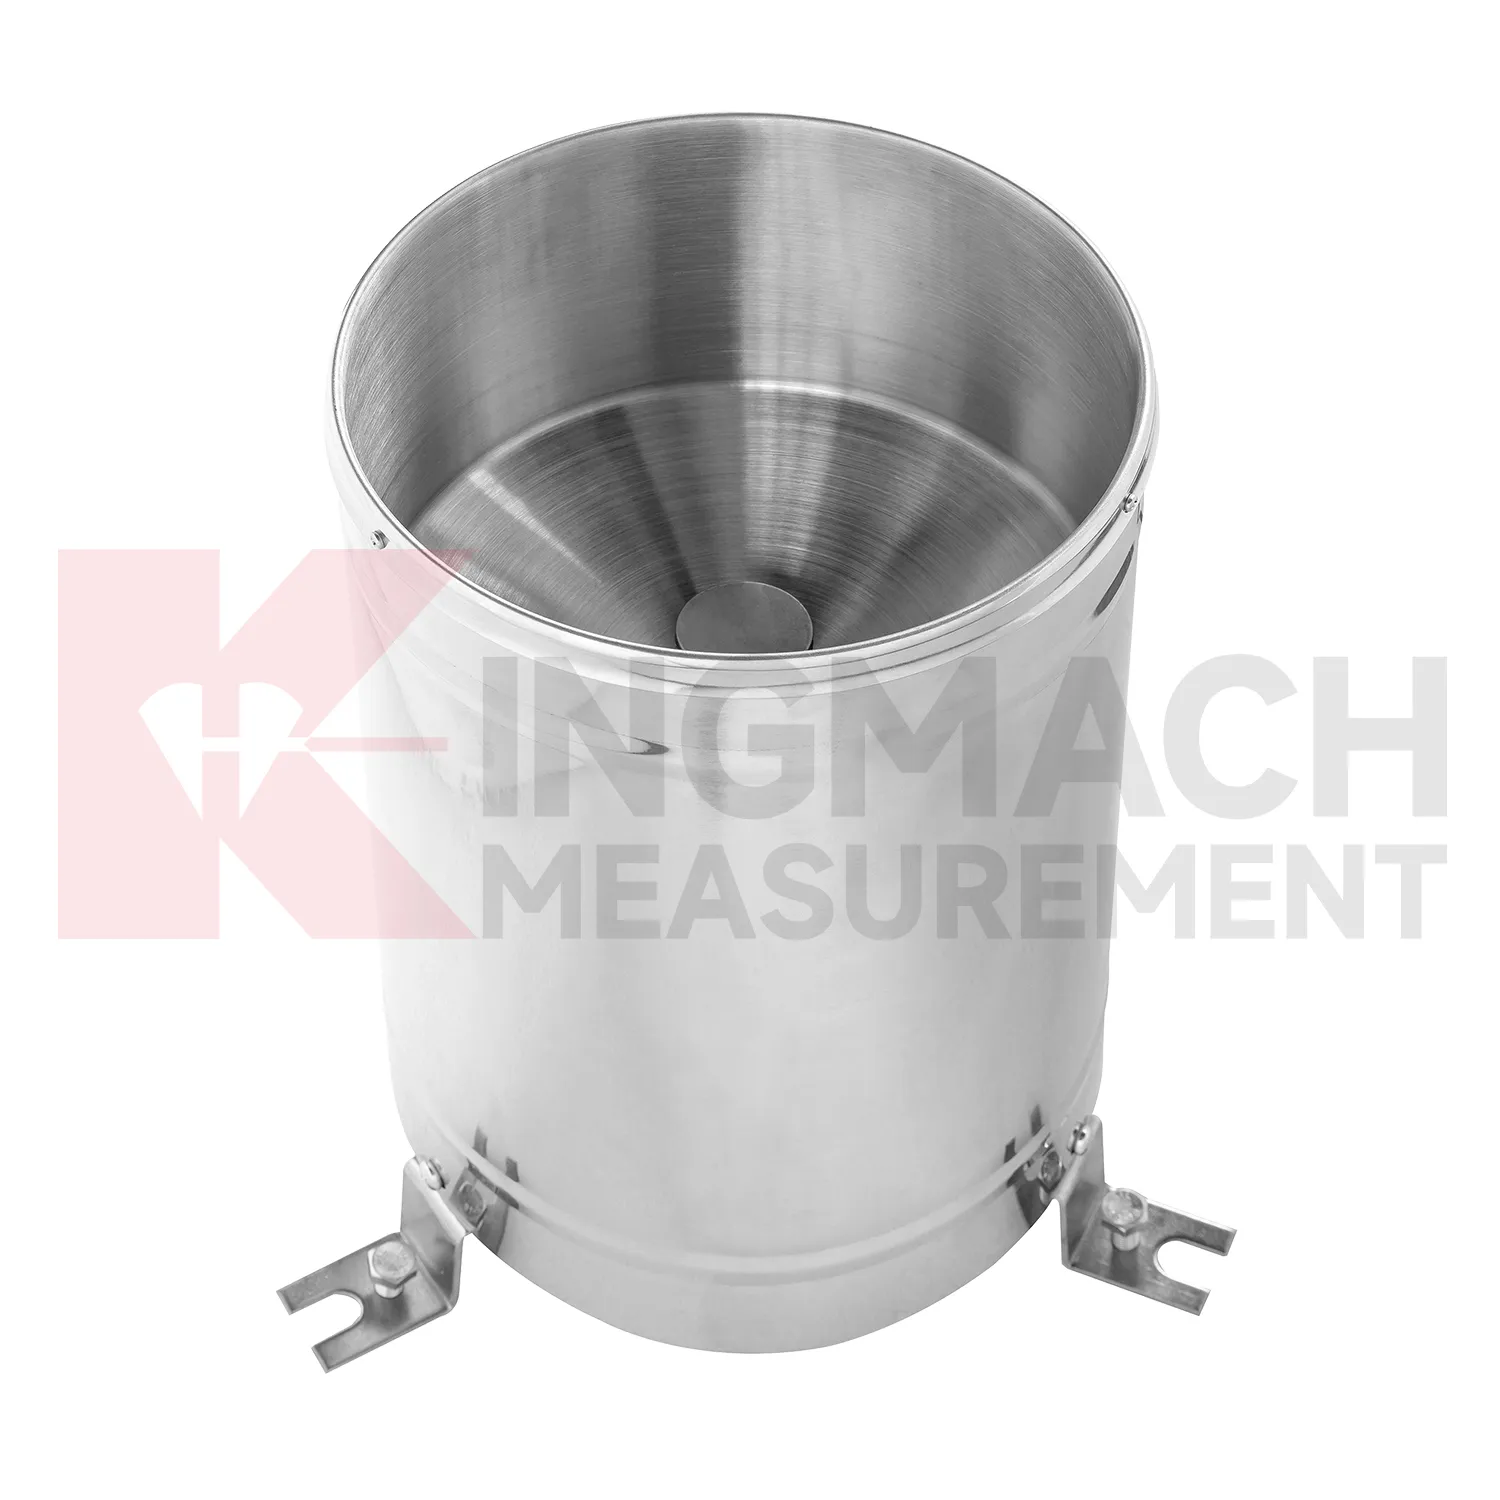
Application of tipping bucket rain gauges
Urban environmental stations use Kingmach tipping bucket rain gauges to support infrastructure management across bridges, tunnels, public buildings, drainage areas, transport corridors, and exposed equipment sites. A station may record rain, wind, air temperature, humidity, pressure, or soil wetness depending on the risk being managed. The most important design rule is representativeness. A rain point blocked by a roof edge, a wind point sheltered by a wall, or a humidity point hidden in an unrelated cabinet can mislead users. Public infrastructure data may be reviewed by many teams, so units, point names, installation photos, and maintenance notes must be clear. A well-run station helps connect environmental change to inspections, drainage response, traffic planning, and structural monitoring.
Long-term value comes from consistency. A channel that keeps the same location, unit, maintenance history, and linked asset record can support seasonal comparison, post-storm review, and handover between construction and operation teams.
Maintenance teams should record cleaning, access difficulty, enclosure condition, cable repair, vegetation growth, nearby equipment changes, and the first normal reading after work. Those notes protect the meaning of the curve when old data is reviewed months later.
The environmental point should be part of a named monitoring question. It may explain wetting, drying, wind exposure, thermal movement, cabinet stress, or pressure variation, but that purpose needs to be visible in drawings and reports.
The future of tipping bucket rain gauges
Remote station health will become more important for Kingmach tipping bucket rain gauges. Environmental points are often placed on slopes, bridges, dams, towers, construction sites, and irrigation areas where access is inconvenient. A future-ready station should report whether it is powered, communicating, collecting plausible values, and recently maintained. Missing data during a storm can be more serious than missing data during calm weather. Maintenance teams need to know whether a silence means quiet conditions, power trouble, blocked equipment, or communication loss. Better station-health reporting will help owners trust environmental data during the events that matter most.
Maintenance teams should record cleaning, access difficulty, enclosure condition, cable repair, vegetation growth, nearby equipment changes, and the first normal reading after work. Those notes protect the meaning of the curve when old data is reviewed months later.
The environmental point should be part of a named monitoring question. It may explain wetting, drying, wind exposure, thermal movement, cabinet stress, or pressure variation, but that purpose needs to be visible in drawings and reports.
Care & Maintenance of tipping bucket rain gauges
Wind-station maintenance for Kingmach tipping bucket rain gauges should preserve exposure and mounting stability. Check for new obstructions, loose poles, tilted brackets, damaged connectors, lightning effects, corrosion, ice, salt, dust, and cable strain. The wind point should represent the monitored bridge, tower, airport area, marine site, tunnel portal, or construction zone. If a nearby structure, scaffold, crane, or temporary cover changes airflow, the record may no longer explain the asset. Maintenance notes should state what was inspected, what was cleaned, and whether the first readings after work looked normal. Reliable wind data depends on both instrument condition and a clear flow path.
A good review habit is to compare the condition channel with the nearest asset behavior instead of reading it as a standalone weather value. That keeps the record tied to slope movement, bridge response, tunnel equipment, dam seepage, drainage behavior, or cabinet reliability.
The installation file should explain why the location represents the monitored area. If the point is sheltered, shaded, exposed, buried, elevated, or placed inside an enclosure, that fact changes how later readings should be understood by maintenance staff.
Kingmach tipping bucket rain gauges
A strong Kingmach tipping bucket rain gauges plan keeps the writing and the system focused on site conditions rather than product lists. The page should help a reader understand how weather, moisture, pressure, temperature, and humidity affect the assets they are responsible for. It should explain how environmental readings support slope review, bridge response, tunnel operation, dam inspection, irrigation control, construction records, and long-term maintenance. It should not read like a catalog of devices or a compressed specification table. The buyer needs a monitoring approach that connects field conditions with engineering decisions. That approach is what makes environmental data worth collecting over months and years.
Maintenance teams should record cleaning, access difficulty, enclosure condition, cable repair, vegetation growth, nearby equipment changes, and the first normal reading after work. Those notes protect the meaning of the curve when old data is reviewed months later.
The environmental point should be part of a named monitoring question. It may explain wetting, drying, wind exposure, thermal movement, cabinet stress, or pressure variation, but that purpose needs to be visible in drawings and reports.
FAQ
Q: How does rainfall data support slope review?
A: Rainfall gives the timing and intensity background for movement, seepage, wetting, and field inspections after storms.
Q: Why measure soil wetness as well as rainfall?
A: Rainfall stays at the surface record, while buried wetness shows whether water reached the soil depth that may influence movement.
Q: How does wind data support bridge or tower monitoring?
A: Wind direction and exposure can explain vibration, deflection, access difficulty, and weather-driven structural response.
Q: Why monitor humidity underground?
A: Humidity can affect cabinets, connectors, corrosion, sensor stability, and operating conditions in tunnels, subways, mines, and equipment spaces.
Q: How does temperature help interpretation?
A: Temperature helps reviewers separate thermal behavior from structural change in strain, displacement, cabinet condition, or material response.
Long-term value comes from consistency. A channel that keeps the same location, unit, maintenance history, and linked asset record can support seasonal comparison, post-storm review, and handover between construction and operation teams.
Reviews
David Wilson
We purchased displacement transducers and settlement sensors, and the quality exceeded our expectations. Easy installation and reliable performance.
Michael Anderson
The strain gauges and load cells are extremely accurate and stable. They performed very well in our bridge monitoring project. Highly recommended!
Latest Inquiries
To protect the privacy of our buyers, only public service email domains like Gmail, Yahoo, and MSN will be displayed. Additionally, only a limited portion of the inquiry content will be shown.
Sophia***@gmail.comUnited Kingdom
Good day, we need environmental monitoring sensors including temperature, humidity, and wind sensors...
Mia***@gmail.comNetherlands
Dear team, we are interested in your readouts & data loggers compatible with multiple sensors. Do yo...
Related product categories
- Temperature Sensor
- Chain-type Temperature Sensor
- Temperature String
- Daisy-Chained Digital Thermometer
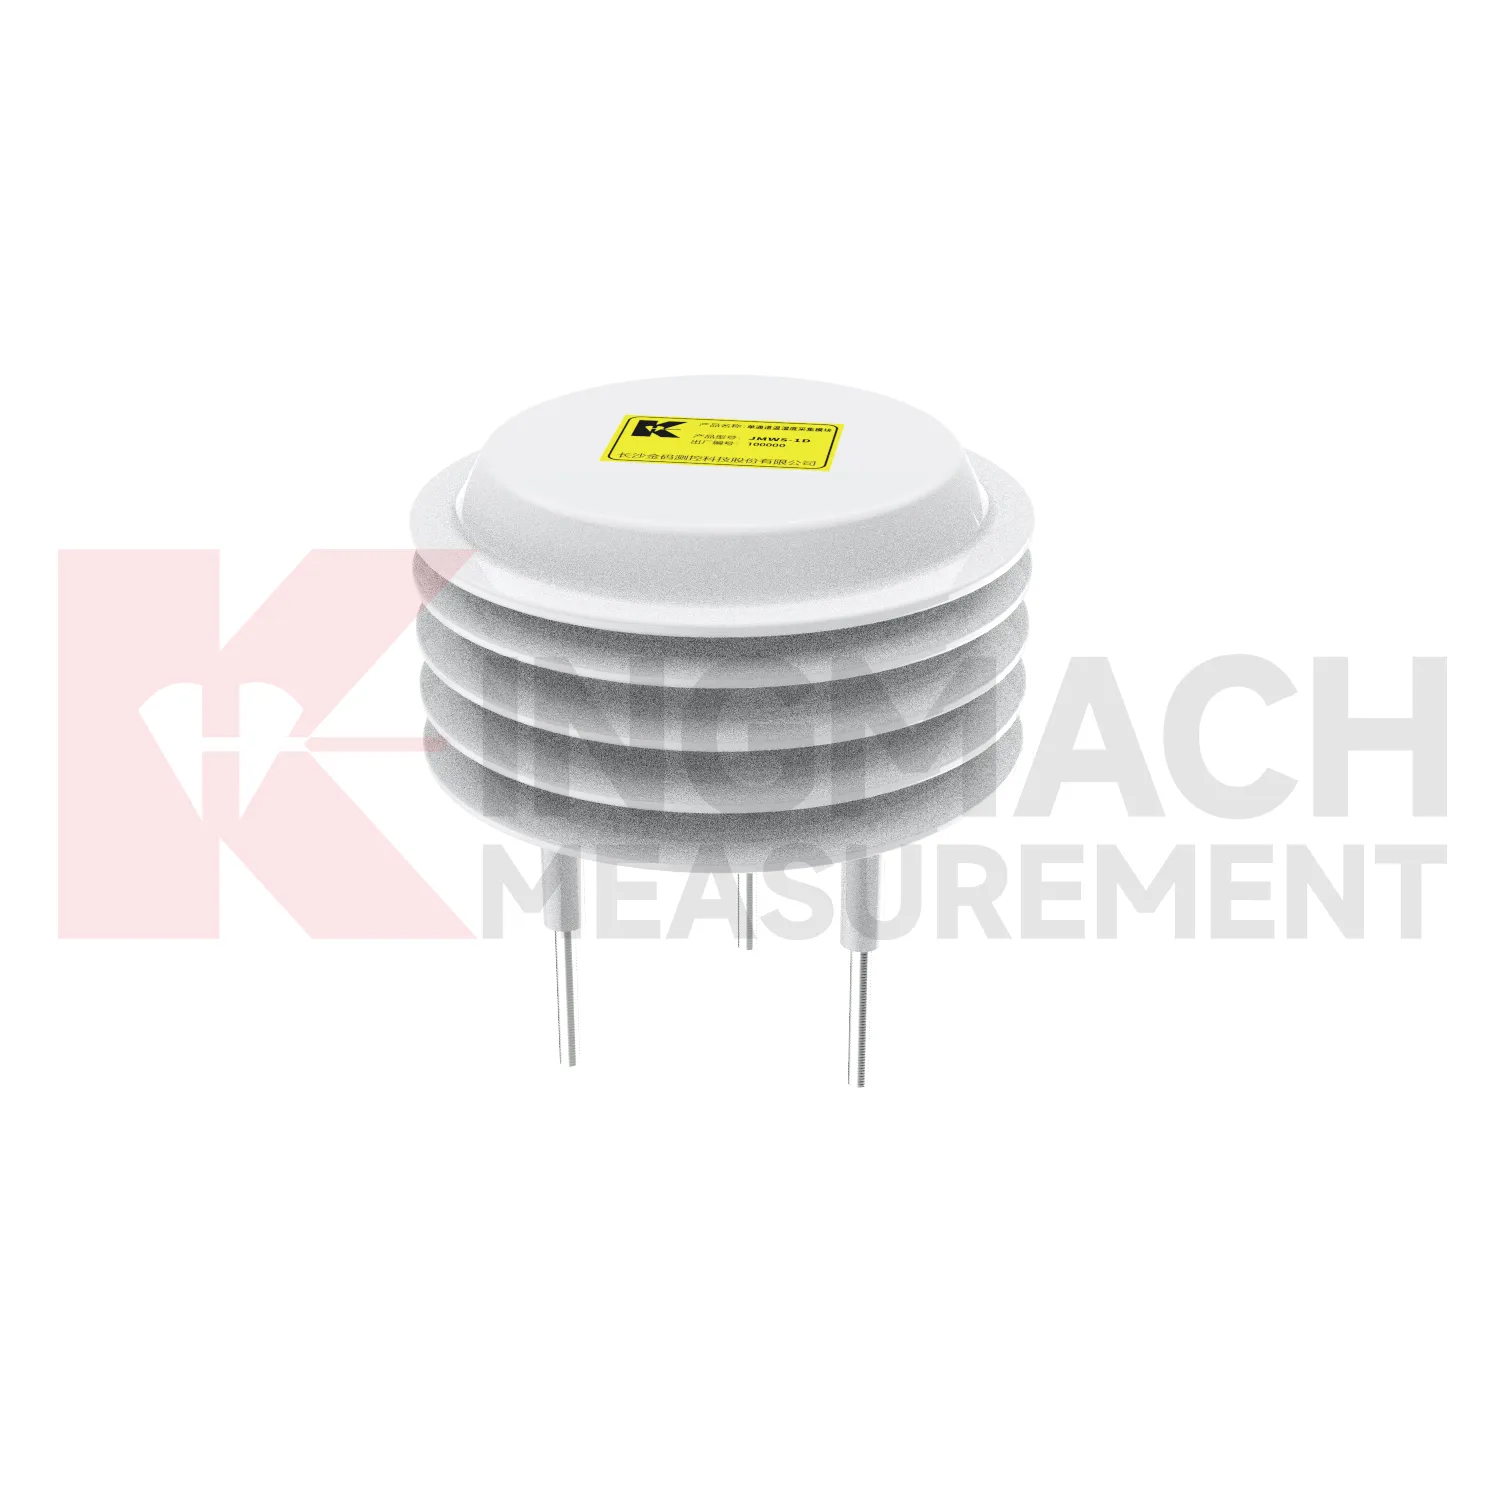
- Single-Channel Temperature and Humidity Acquisition Module
- Environmental Monitoring
- Integrated Monitoring Station
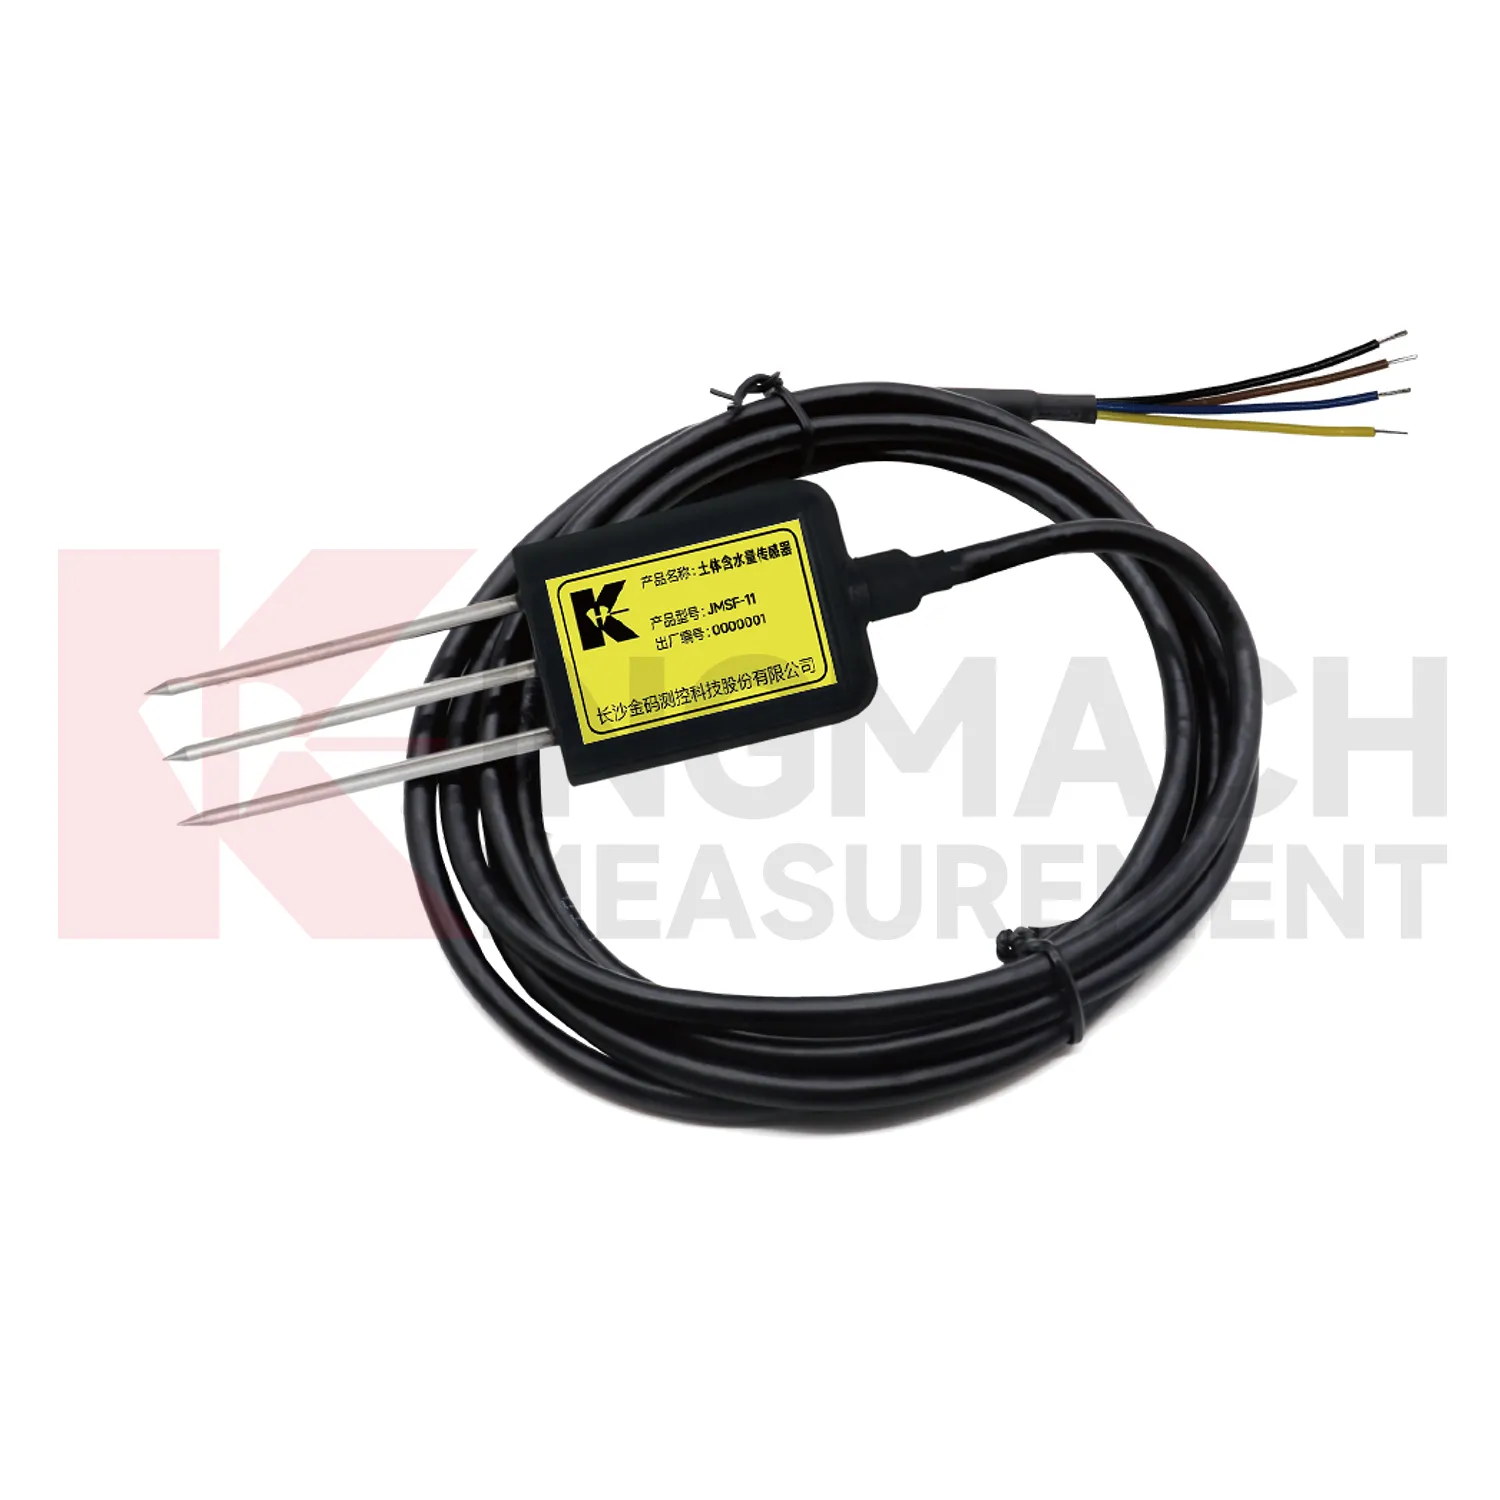
- Soil Water Content Sensor
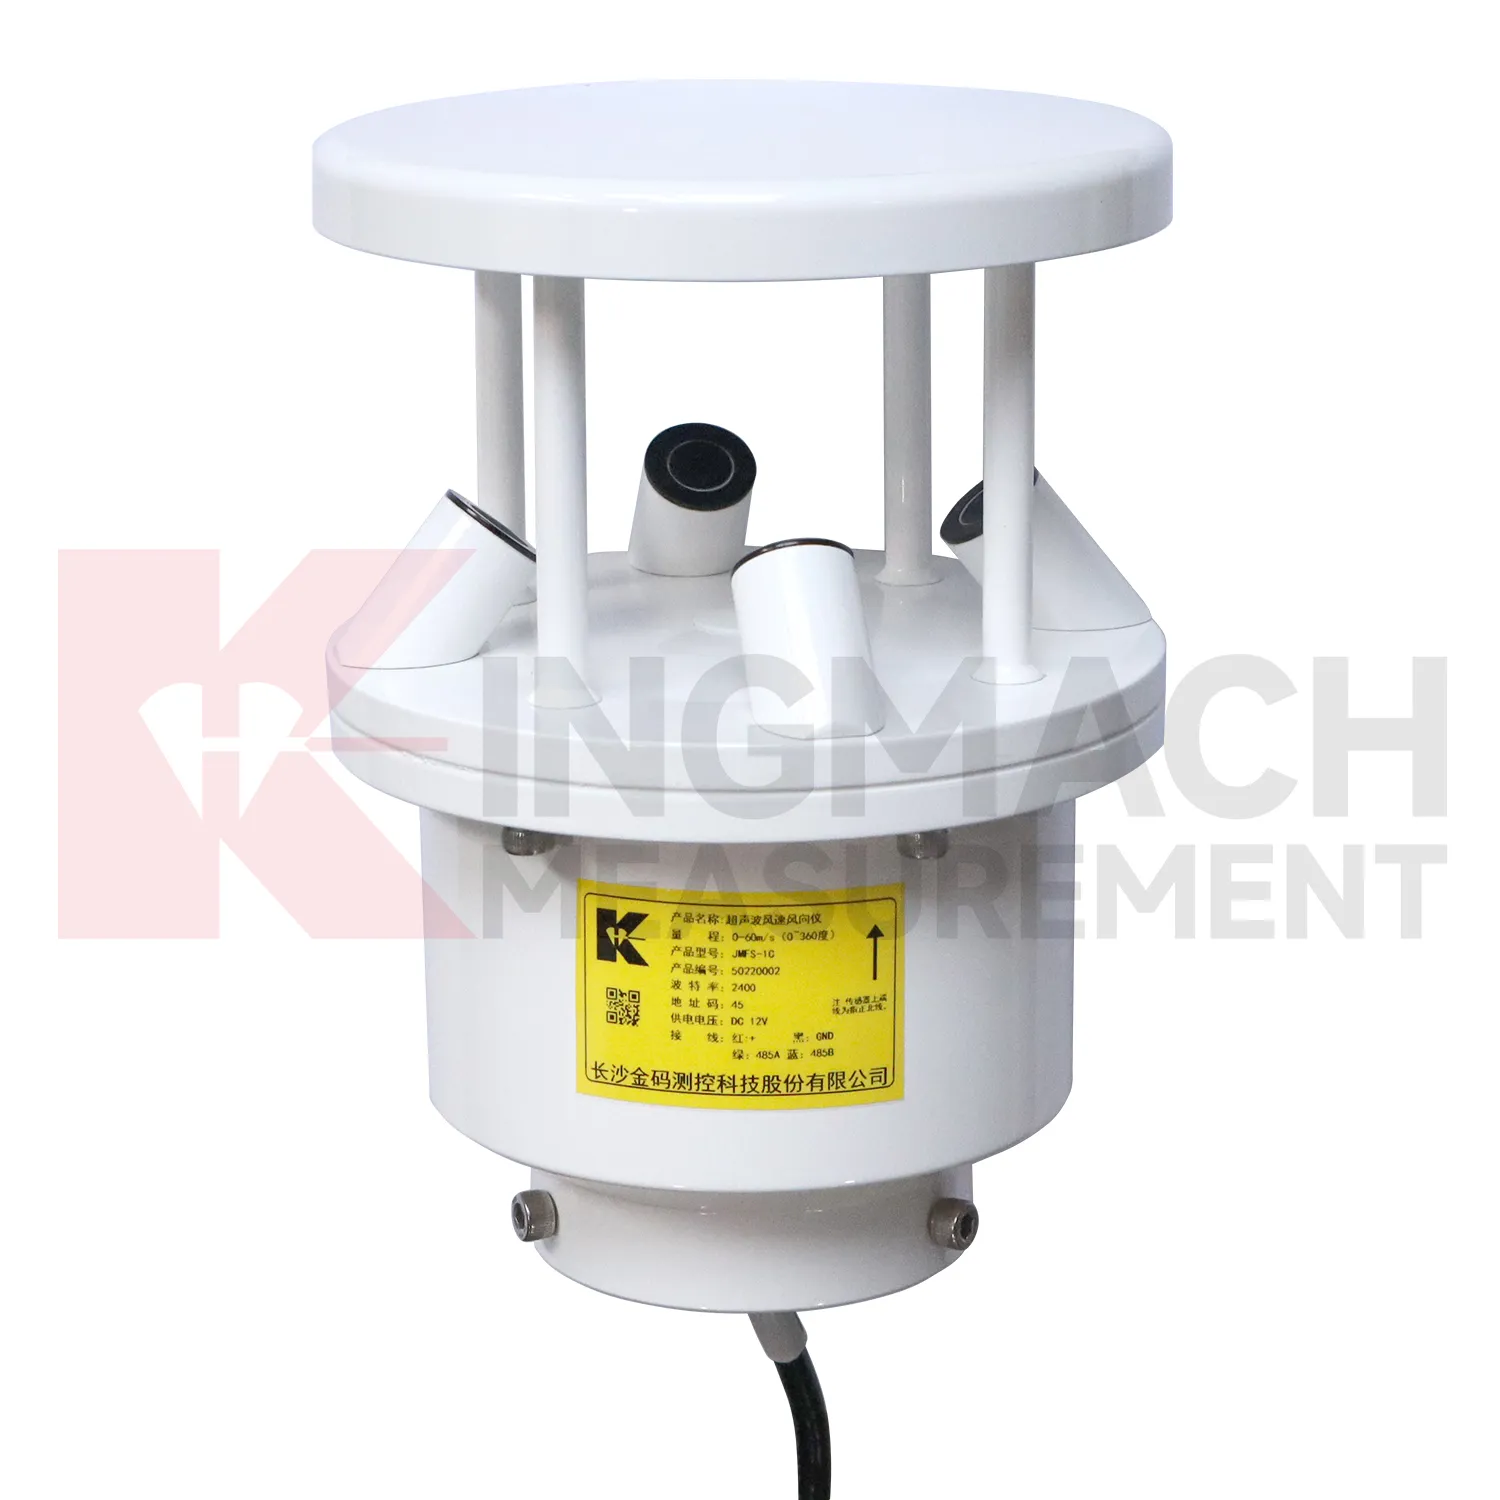
- Ultrasonic Anemometer
- semiconductor temperature sensor
- semiconductor based temperature sensors
- semiconductor temperature sensors